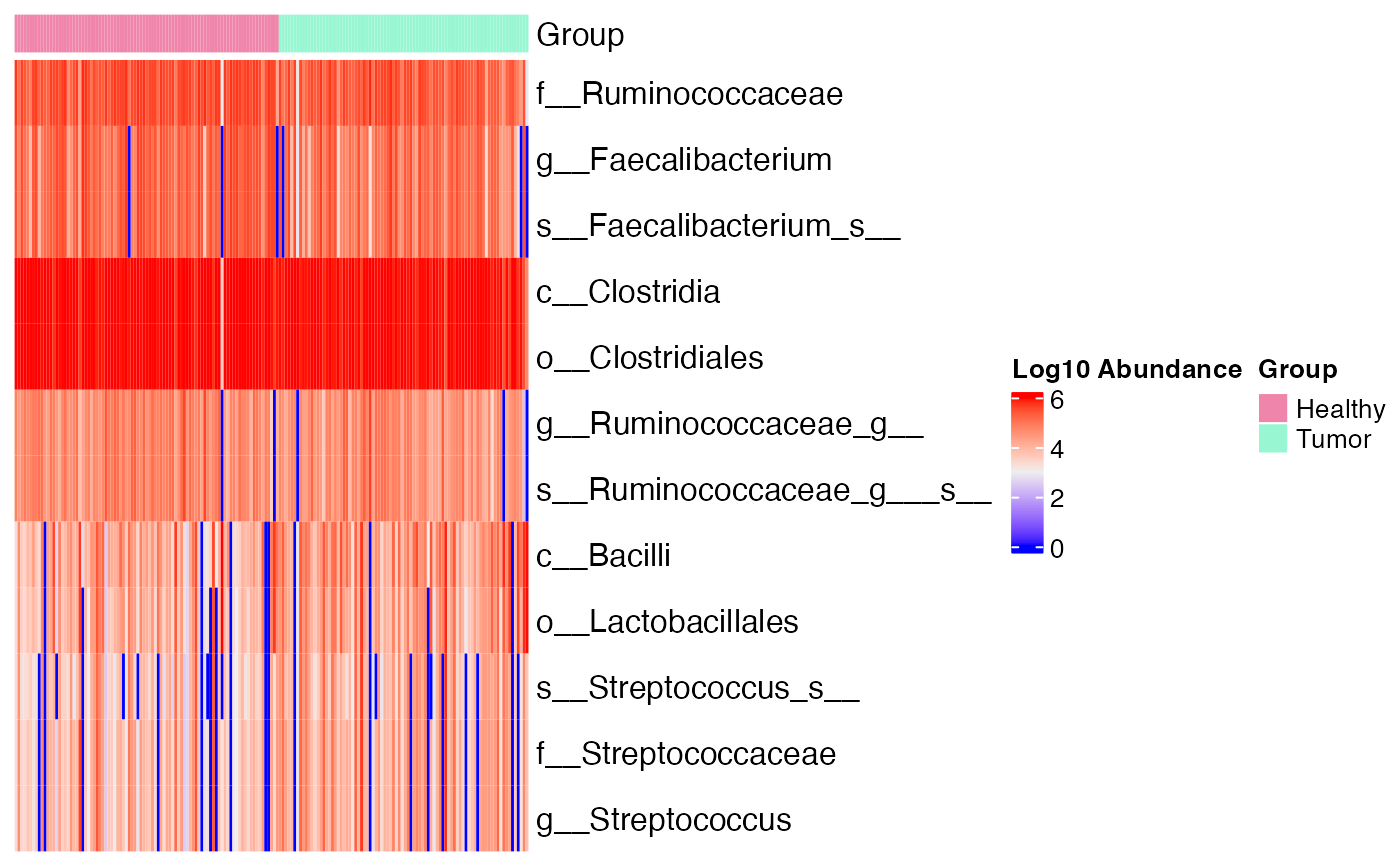
Display the microbiome marker using heatmap, in which rows represents the marker and columns represents the samples.
plot_heatmap(
  mm,
  transform = c("log10", "log10p", "identity"),
  cluster_marker = FALSE,
  cluster_sample = FALSE,
  markers = NULL,
  label_level = 1,
  max_label_len = 60,
  sample_label = FALSE,
  scale_by_row = FALSE,
  annotation_col = NULL,
  group,
  ...
)
Arguments
- mm
a
microbiomeMarkerobject- transform
transformation to apply, for more details see
transform_abundances():"identity", return the original data without any transformation.
"log10", the transformation is
log10(object), and if the data contains zeros the transformation islog10(1 + object)."log10p", the transformation is
log10(1 + object).
- cluster_marker, cluster_sample
logical, controls whether to perform clustering in markers (rows) and samples (cols), default
FALSE.- markers
character vector, markers to display, default
NULL, indicating plot all markers.- label_level
integer, number of label levels to be displayed, default
1,0means display the full name of the feature- max_label_len
integer, maximum number of characters of feature label, default
60- sample_label
logical, controls whether to show the sample labels in the heatmap, default
FALSE.- scale_by_row
logical, controls whether to scale the heatmap by the row (marker) values, default
FALSE.- annotation_col
assign colors for the top annotation using a named vector, passed to
colinComplexHeatmap::HeatmapAnnotation().- group
character, the variable to set the group
- ...
extra arguments passed to
ComplexHeatmap::Heatmap().
Value
a ComplexHeatmap::Heatmap object.
Examples
data(kostic_crc)
kostic_crc_small <- phyloseq::subset_taxa(
    kostic_crc,
    Phylum %in% c("Firmicutes")
)
mm_lefse <- run_lefse(
    kostic_crc_small,
    wilcoxon_cutoff = 0.01,
    group = "DIAGNOSIS",
    kw_cutoff = 0.01,
    multigrp_strat = TRUE,
    lda_cutoff = 4
)
plot_heatmap(mm_lefse, group = "DIAGNOSIS")
#> Warning: OTU table contains zeroes. Using log10(1 + x) instead.
