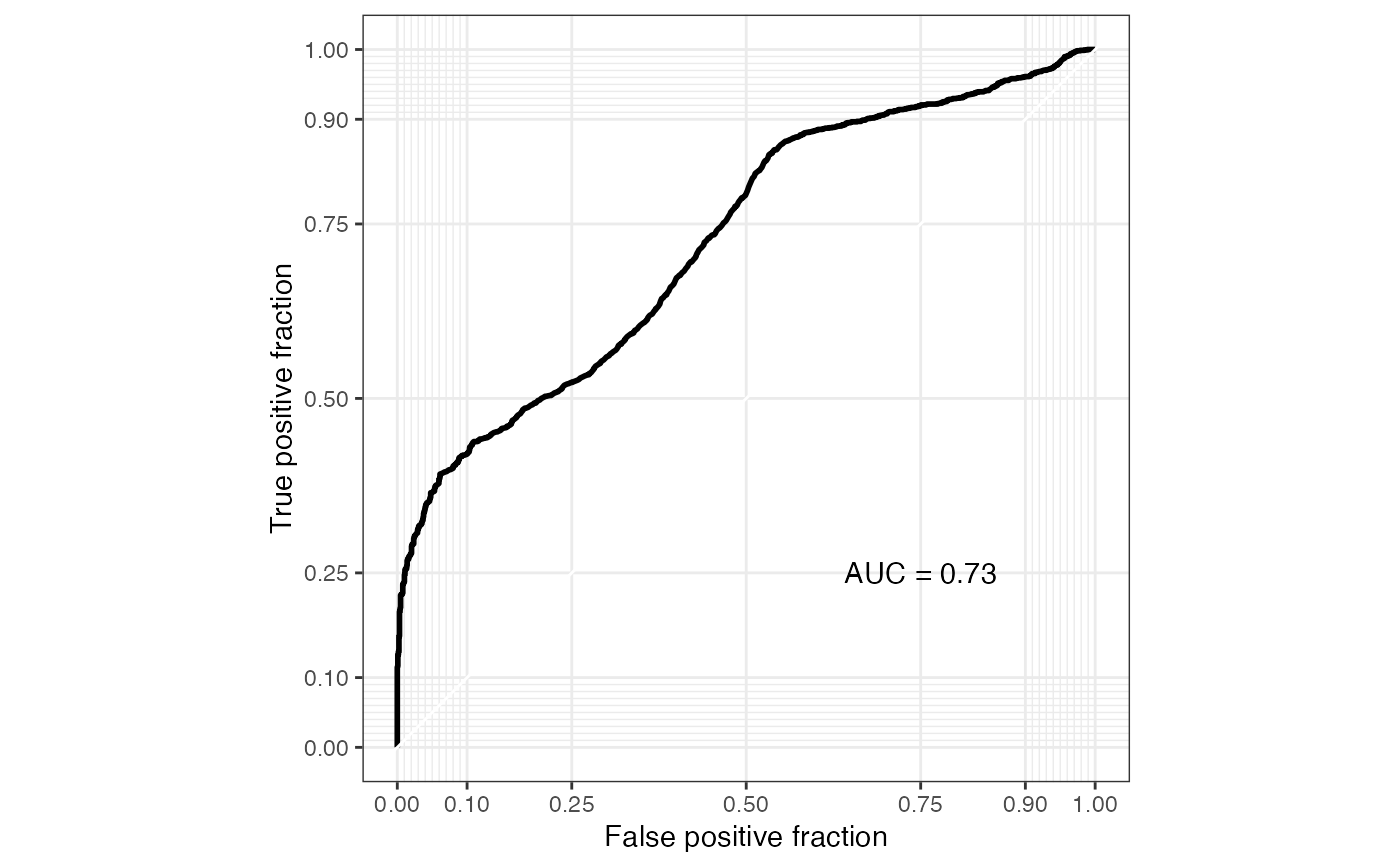
ROC curve of microbiome marker from supervised learning methods
Source:R/plot-sl-roc.R
plot_sl_roc.RdShow the ROC curve of the microbiome marker calculated by run_sl.
plot_sl_roc(mm, group, nfolds = 3, nrepeats = 3, tune_length = 5, ...)Arguments
- mm
a microbiomeMarker object.
- group, nfolds, nrepeats, tune_length, ...
same with the
run_sl().
Value
a ggplot2::ggplot object.
See also
Examples
data(enterotypes_arumugam)
# small example phyloseq object for test
ps_s <- phyloseq::subset_taxa(
    enterotypes_arumugam,
    Phylum %in% c("Firmicutes", "Bacteroidetes")
)

set.seed(2021)
mm <- run_sl(
    ps_s,
    group = "Gender",
    taxa_rank = "Genus",
    nfolds = 2,
    nrepeats = 1,
    top_n = 15,
    norm = "TSS",
    method = "LR",
)
#> Loading required package: ggplot2
#> Loading required package: lattice
plot_sl_roc(mm, group = "Gender")