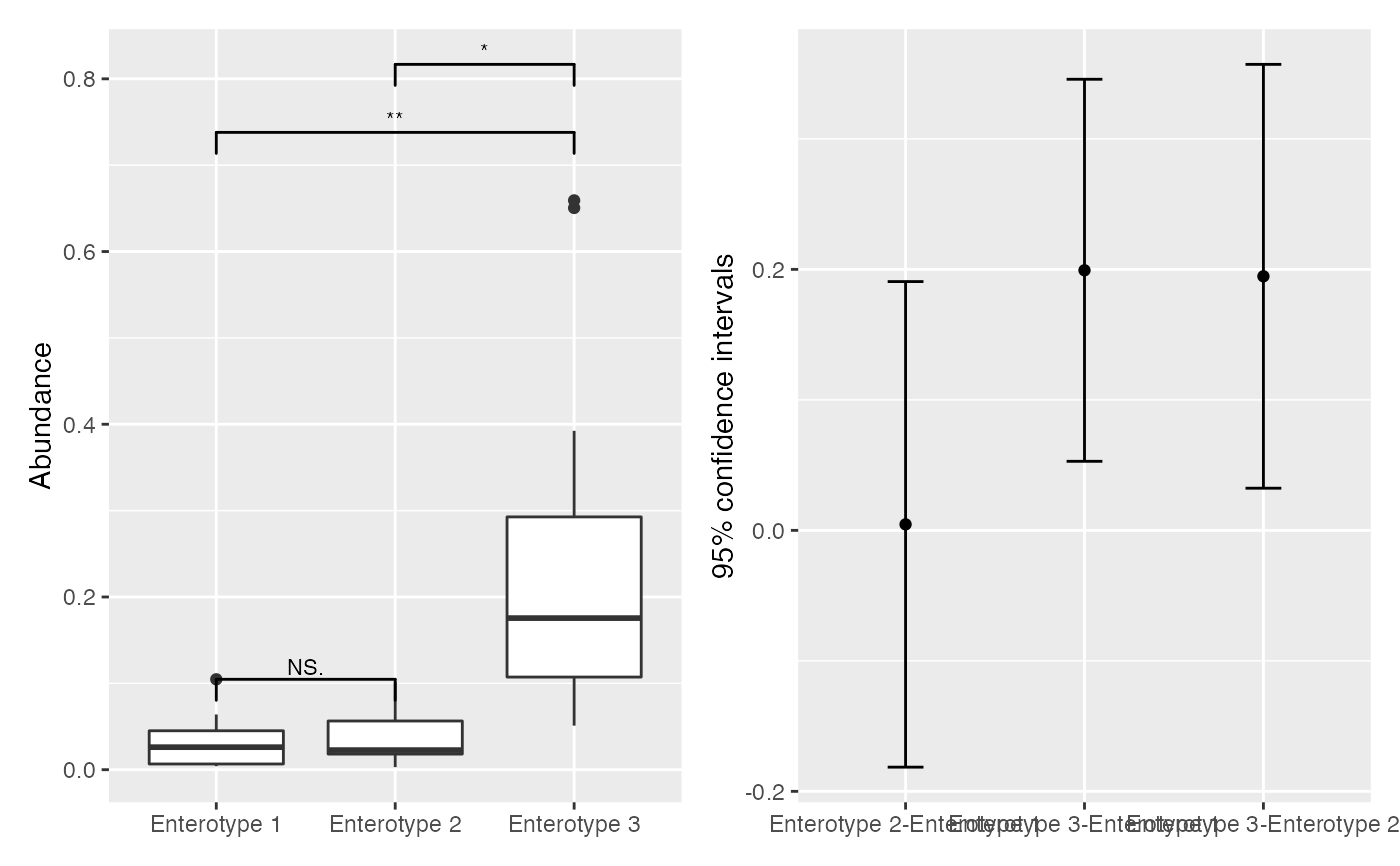
Visualize the result of post-hoc test using ggplot2
plot_postHocTest(pht, feature, step_increase = 0.12)Arguments
- pht
a
postHocTestobject- feature
character, to plot the post-toc test result of this feature
- step_increase
numeric vector with the increase in fraction of total height for every additional comparison to minimize overlap, default
0.12.
Value
a ggplot object
Examples
data(enterotypes_arumugam)
ps <- phyloseq::subset_samples(
    enterotypes_arumugam,
    Enterotype %in% c("Enterotype 3", "Enterotype 2", "Enterotype 1")
) %>%
    phyloseq::subset_taxa(Phylum == "Bacteroidetes")
pht <- run_posthoc_test(ps, group = "Enterotype")
plot_postHocTest(pht, feature = "p__Bacteroidetes|g__Alistipes")