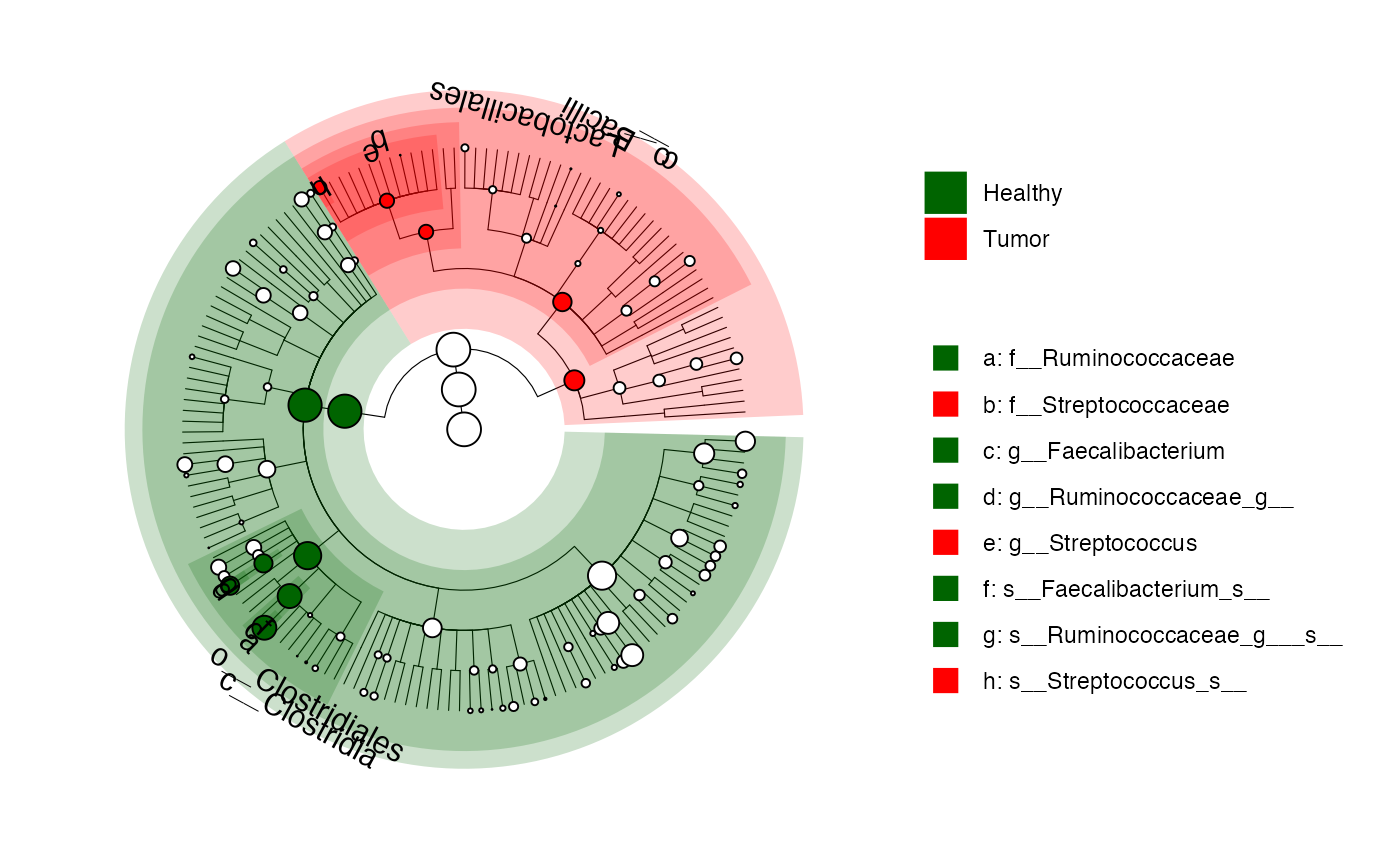
plot cladogram of micobiomeMaker results
Arguments
- mm
a microbiomeMarker object
- color
a color vector, used to highlight the clades of microbiome biomarker. The values will be matched in order (usually alphabetical) with the groups. If this is a named vector, then the colors will be matched based on the names instead.
- only_marker
logical, whether show all the features or only markers in the cladogram, default
FALSE.- branch_size
numeric, size of branch, default
0.2- alpha
alpha parameter for shading, default
0.2- node_size_scale
the parameter 'a' controlling node size:
node_size=a*log(relative_abundance) + b- node_size_offset
the parameter 'b' controlling node size:
node_size=a*log(relative_abundance) + b- clade_label_level
max level of taxa used to label the clade, other level of taxa will be shown on the side.
- clade_label_font_size
font size of the clade label, default 4.
- annotation_shape
shape used for annotation, default
22- annotation_shape_size
size used for annotation shape, default
5- group_legend_param, marker_legend_param
a list specifying extra parameters of group legend and marker legend, such as
direction( the direction of the guide),nrow(the desired number of rows of legends). Seeggplot2::guide_legend()for more details.
Value
a ggtree object
References
This function is modified from clada.anno from microbiomeViz.
See also
Examples
data(kostic_crc)
kostic_crc_small <- phyloseq::subset_taxa(
    kostic_crc,
    Phylum %in% c("Firmicutes")
)
mm_lefse <- run_lefse(
    kostic_crc_small,
    wilcoxon_cutoff = 0.01,
    group = "DIAGNOSIS",
    kw_cutoff = 0.01,
    multigrp_strat = TRUE,
    lda_cutoff = 4
)
plot_cladogram(mm_lefse, color = c("darkgreen", "red"))
