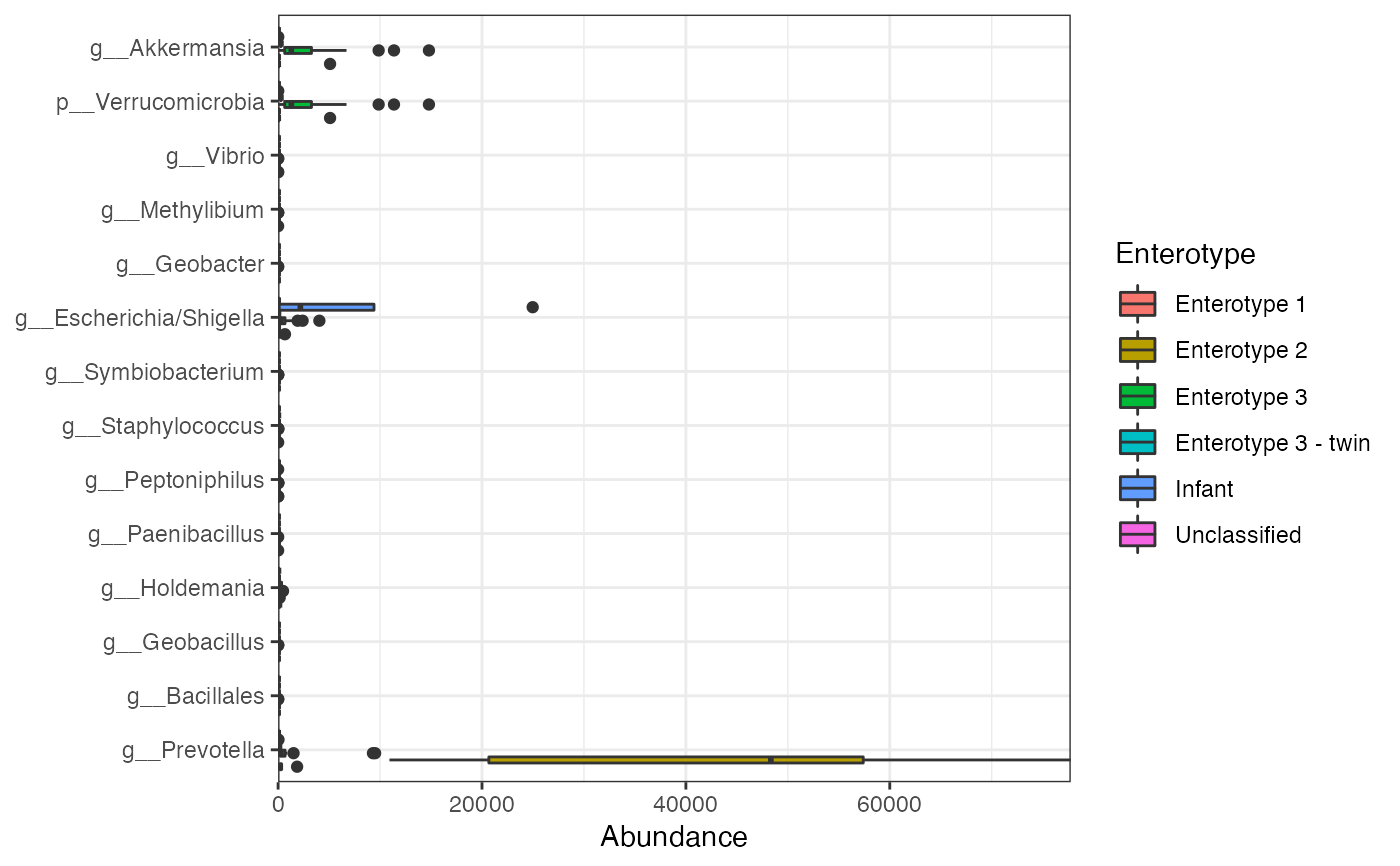
plot the abundances of markers
plot_abundance(mm, label_level = 1, max_label_len = 60, markers = NULL, group)Arguments
- mm
a
microbiomeMarkerobject- label_level
integer, number of label levels to be displayed, default
1,0means display the full name of the feature- max_label_len
integer, maximum number of characters of feature label, default
60- markers
character vector, markers to display, default
NULL, indicating plot all markers.- group
character, the variable to set the group
Value
a ggplot2::ggplot object.
Examples
data(enterotypes_arumugam)
mm <- run_limma_voom(
    enterotypes_arumugam,
    "Enterotype",
    contrast = c("Enterotype 3", "Enterotype 2"),
    pvalue_cutoff = 0.01,
    p_adjust = "none"
)
plot_abundance(mm, group = "Enterotype")